Oct 11 2012

Thermo for Normals (part 24): Some closing thoughts on the 3 laws

At last we know all 3 laws of thermodynamics:

  1. Internal energy of a system increases when heat is added to it and decreases when it does work ().
  2. No cyclic process can turn heat entirely into work.
  3. Absolute zero cannot be attained.

The first two of these statements encompass all of what we think of as classical thermodynamics, and they actually describe a ton of stuff without ever needing to think about the atoms, what the forces between the atoms are, or quantum mechanics. You can start to understand engines, air conditioning, evaporation, condensation, and all sorts of other things that you see all the time with just these few rules.

The laws are actually quite general in my opinion. This is a double-edged sword: they are widely applicable, but when you run into a problem, the laws aren't specific enough to resolve them. An example comes to mind. If you put salt into water, the boiling point of the solution is higher than the boiling point of water, due to the extra mass. It happens because you added small particles to the water. What the hell is "small" anyway, though? What if I put a big rock into the water...would it still have this effect?! This is the limit of thermodynamics. Since we aren't really talking about the things that actually exist, we are not able to resolve issues like this.

This doesn't mean that it's useless by any means. In fact, just what we've touched on so far is extremely useful and interesting. But if we want to know more specifics, we can't ignore the actual atoms, their actual velocities, and such. That's where we're heading, and that's where we can really get to know what entropy and internal energy really are. However, it requires use of statistics and probability, and also a knowledge of logarithms and exponential functions. If the reader was to tune out now, I would understand.

But I think that in continuing on, a little bit of effort in thinking about these concepts yields great reward. I've said that in a gas some of the atoms are going faster than others. But you might wonder: well, how many are moving fast? How much faster are they going? To answer these and other questions, we have to change from thermodynamics to statistical mechanics (really just a fancy way of saying that you want to generalize about the laws of mechanics to large numbers of particles). It will turn out in the end that this topic has a few easy to remember rules; we just need to do a little bit of work to get to those rules.

Oct 10 2012

Strange things in conditional probability

A test for cancer is positive 99% of the time that a patient actually has cancer, and is negative 95% of the time a patient does not have cancer (suppose only 1/1000 in the population has this type of cancer). Question: if a patient's test comes up positive, what is the probability he has cancer?

This is a simple-sounding question and one that is definitely pertinent. One might reason that it's either 99%, or 95%, but neither is correct. It's only about a 2% chance that the patient has cancer if his test comes up positive.

Why is this, and what do the probabilities above represent if not the answer to this question? Both are conditional probabilities: The first says that if a person has cancer, then his test is positive 99/100 times and negative 1/100 times. The second says that if a person does not have cancer, then his test is positive 5/100 times and negative 95/100 times. Finally, we know that 1 person out of 1000 has this cancer. Never do we say what the probability is of having cancer if the test came up positive.

The tree diagram for all possible cases is above. What you're trying to evaluate is what the probability is of being in the top-most group (has cancer and tested positive) if all you know is that you tested positive.

Prior and posterior probability

Any time that we are given some extra information, we need to reweigh our odds. As a simple example, say your friend rolls a die and asks you to guess the number it came up. The probability of any given number coming up is 1/6, and so your chances are only 1 in 6 of guessing correctly. But if the person posing the question then tells you that the number that came up is greater than 4, now you have a 1/2 probability of guessing it correctly, since only two equally probable options are possible (a 5 or a 6). Your odds have greatly improved.

A slightly less simple example: suppose we have two bags, called I and II. Bag I has 2 red and 3 green balls. Bag II has 1 red ball and 1 green ball. We randomly choose a bag, and randomly choose a ball from that bag.

We can now answer some questions. What is the probability of choosing a red ball? It's the probability of choosing bag I and choosing a red from it, plus the probability of choosing bag II and a red from it. We just add all branches that end in red:

But let's add a conditional. Suppose you want to know what the probability of choosing red is given that bag I has been chosen. We can write it , so the line means "given". If we know we've chosen bag I, then the probability of getting red is just 0.4, since we know we're confined to that part of the tree. Simple.

Now we ask another question: suppose we picked a red ball. What is the probability we chose bag I? Not so simple! You might think it's 2/3, since 2 out of 3 red balls reside in bag I. But you aren't as likely to pick these as you are to pick a red ball from bag II. We need a systematic way to figure out the likelihoods.

First, whenever possible I like to run the experiment and see what the answer is. Since this would be time consuming, we just have a computer do it 5000 times, choosing random numbers according to the specified probabilities. I get these numbers of outcomes:


red green totals
bag I 1038 1461 2499
bag II 1215 1286 2501
totals 2253 2747

The observed probability of choosing red given that bag I was been chosen is 1038/(1038+1461) = 0.4154, close to the value we calculated of 0.4. Now, we can also calculate the probability of having chosen bag I if you got red, which is 1038/(1038+1215) = 0.4607, somewhat different from 2/3.

Calculating proportions across the rows of the table is like calculating in the tree above, giving the prior probabilities. Calculating down the columns is doing the inverse dependence, called the posterior probabilities. The row has information about probability of red given bag I, whereas the column has information about the probability of bag I given red. And it is the posterior probability for the cancer question that we want to get at. That is, we know all about what happens to the tests given cancer or no cancer, but we want to know cancer/no cancer given a test result of positive.

With the above in mind, it ought to be clear that

The numerator is the probability of getting red from bag I, which the tree tells us is 0.2, and the denominator is the probability of getting a red in any way, which the tree tells us is 0.2 + 0.25 = 0.45. This value is similar to the simulation. It's a bit neater to write , the probability of getting red from bag I, as

Both and represent sets, so this is the intersection of sets.

Finally

In exact analogy to the previous problem, the probability of having cancer given that your test was positive is

or about a 2% chance. Most tests that come up positive under such conditions are false positives. In retrospect, this should have been obvious. If we look at all the people who got positive results, a much larger proportion are in the third branch of the tree diagram, a false positive. Grinstead and Snell report that when "a group of second-year medical students was asked this question, over half of the students incorrectly guessed the probability to be greater than .5". Even if both tests were 99% accurate, the probability of a false positive would still only be 1/2, not larger.

Oct 05 2012

Moderate Romney a genuine threat to Obama

Mitt Romney's campaign, in the days leading up to Wednesday, said that he was ready with a number of "zingers". This feint made it seem like "47%" hating, plutocrat Thurston Howell Romney was going to come out swinging and defend his campaign and his running mate's budget.

He didn't. He changed the fundamental message of his campaign and didn't telegraph it. Obama was blindsided, and, in many people's opinion, dumbfounded.

During the course of three days Romney went from a conservative nightmare to a reasonable-sounding moderate. In the debate, he said he favored redistribution in the Medicare system, he advocated for keeping parts of Obamacare and much of Dodd-Frank. He insisted that he was not for cutting rich people's taxes. The next day he went on Fox News and denounced his own comment on the 47%. He then said that all those illegal immigrants that Obama was letting stay, he'd let stay as well.

In short, Romney went from an opponent Obama was hoping for to the one he ought to fear the most. The severe conservative became the former peacemaker who governed Massachusetts and passed universal health care.

It's strange that this hadn't already happened. When Eric Fehrnstrom stated that the campaign was an Etch-a-Sketch, what I was thinking was that 2007 Romney would return and go out promising Obama-plus-more-jobs on day 1. He'd pick a safe and similarly moderate running mate and go out to pummel Obama on 8% unemployment, stagnant wages, Solyndra, the deficit, trade agreements, and the administration's terrible record on housing.

Instead, Romney picked an extremist, Paul Ryan, as his running mate. He went out saying we didn't need more teachers, that he liked firing people, that Obama was out to make welfare queens by ending welfare-to-work. He said that Medicare should be premium supported and Medicaid should be funded more by the states.

The argument didn't work. States like Wisconsin that ought to have been in play started to look unwinnable. Bill Clinton went up and decisively refuted all his arguments about social programs. And then came the "47% tape", a devastating reflection on an out-of-touch rich man trying to buy his way into office, that the campaign did not immediately disown (Romney merely said that he stated it poorly). Soon after, conservatives started to scream. David Brooks said Romney was pretending to be a cartoon Republican when he wasn't. Peggy Noonan called the campaign a "calamity". Advisors to Romney began to grouse to Politico about the terrible state of the campaign. Romney's electoral chances looked slim.

This turnaround was necessary. The Mitt who was running for the past two months was never going to be president, but this one, supposing he will stick with it, could.

The argument from the Democrats is now obvious: sure, Romney says all that now, but which Mitt Romney will you get if you actually elect this guy? It's a good argument, and it ought to work. But his fellows tried this in the primary campaign, and Mitt won anyway.

60 million people tuned into the first debate. For many of them, this was the first time they have thought seriously about domestic policy in any real way for 2 years. What they heard was two men, one who was ambling and unsure, and another who had similar good ideas but some criticisms that seemed founded and went unrebutted. It would be shocking if some of these 60 million were not swayed to vote for Romney by what they heard. The question is whether this turnaround happened too late to make a difference.

Oct 05 2012

Understanding polls (part 1)

Let's say that we want to know how many people are going to vote for Obama and how many for Romney. The population of all voting people has a certain distribution (a number who vote for one, another number who vote for the other). For the sake of argument let's say it looks like this:

A hypothetical population distribution of voting totals.

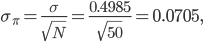
This is the population distribution. Now, we do not know this distribution, and we will not know it until election results actually come in. Since it's not practical to call each voter and ask what her preference is, a polling firm takes a sample. They might call 2,200 people chosen from many states and ask whom they intend to vote for, and tally the result. For instance, the latest Gallup poll put the proportions at Obama 49%, Romney 45%.

In this and some following posts, I want to address this question: what is the meaning of this poll result?

To begin to answer the question, let's run a simulation. We'll make a random number generator give us a number between 0 and 1. If the number it gives is less than or equal to 0.539 (Obama's hypothetical vote share) we count that as a person answering Obama, and if it's greater than 0.539 then we count that as a person answering Romney. Because the sample is random, we do not expect to get the exact proportion of the population distribution (we don't expect to get exactly 53.9%).

To start, we'll take a sample of 50 people. On the first simulation, 22 said Obama, and 28 for Romney, or 44%/56%. Curious, since it not only does not get the number right, it actually shows Romney with a lead. On the second run, I get 27 for Obama, and 23 for Romney (54%/46%). On a third trial, it's 62%/38%. We can see that with a random sample of only 50 people, we don't get very close to the real result and it's very noisy.

We can look at the distribution of the sampling mean, or the frequency of a certain result if we run our "poll" many times. Let's look at the number of times we get a certain percentage for Obama if we run the poll 100 times:

Sampling distribution obtained for a random sample with the above population distribution, polling 50 people. 100 "polls" were conducted to get this distribution.

The result is quite messy. Some of the polls show Obama under 45%, others show him well over 60%. However, the average of all polls is 53.7% of the vote for Obama, essentially what it is for the population distribution!

You might wonder whether we have any expectation for what this distribution should look like. To illustrate that we do, here's the exact same simulation except I ran it 1000 times instead of only 100. It's the same random number generator, the same number of people polled (N=50).

Sampling distribution polling 50 people, and running 1000 "polls".

What we get is a bell-shaped curve. Suppose I calculate the mean and the standard deviation of the results. Then, if I plot this same plot (except I divide by the maximum 109) along with the function

I get the following graph

Normalized simulation data for 1000 trials along with a normal distribution with the same mean and standard deviation as the results.

The curve in magenta, given by the formula above, is the normal distribution, and it fits extremely well. Since the standard deviation of these poll results is 7%, this curve being the trend implies that

  • 63% of all your poll results are within seven percentage points of the true proportion
  • 95% of all your poll results are within fourteen percentage points of the true proportion
  • 99% of all your poll results are within 21 percentage points of the true proportion

That means that if you only do one poll, you have no confidence at all that it is close to the true proportion.

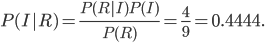
Seven percentage points is actually much smaller than the population standard deviation. If you let a vote for Obama equal 1 and a vote for Romney equal zero, and calculate the standard deviation of the population, you get

or a standard deviation of almost 50 percentage points. So actually our poll result has a smaller standard deviation than the actual population (which is good, since 50 points would be huge!). How much smaller?

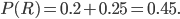
The standard deviation of the sampling distribution is

exactly what we observed in our experiment. This is to say that the random error in your sample goes down as , the number of people polled in each poll, goes up, but only as the square root.

What will the standard deviation be for a poll of 2200 people, such as the one Gallup conducts? It's

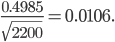
Thus, from a sampling standpoint alone, the Gallup poll has a relatively small 1 percentage point deviation. This isn't the end of the story, not by a long shot! But, as a first approximation, we might say that there is a 99% chance that the true result is either 3 points higher or 3 points lower than what Gallup measures. Thus, when you see a margin of error in the result like , this reflects that the sample size being what it is, it is impossible to conclude with precision what the real population value is in this range by taking a sample; it could plausibly be anywhere between 51 and 57%.

More to come.

Oct 03 2012

Three hypotheses as to why Obama sucked tonight

Yeah, not so much.

1. The president is rusty or worn out. As Jake Tapper tells it (no link), this is the version of Obama from the summer of 2007, where the listless senator lazily moved from chore to rhetorical chore at the stump. He didn't prepare enough, didn't expect much from his opponent, and didn't think he needed to fight too hard when he's this far ahead.

2. Obama was thrown by Romney's new new positions. Matt Yglesias is right off the bat with the assertion that Romney has once again shaken the Etch-a-Sketch, this time redrawing himself as a reasonable moderate who knows that "regulation is essential" and that Medicare must be preserved by making "benefits high for those that are low-income". The latter policy is redistributionist in a way that is completely reasonable and popular. The former is at odds with the highly unpopular far right.

3. Strategy It's probably that this is giving the Obama campaign too much credit, but there could be something to say for playing prevent defense. If the campaign decided that it's better not to tip their strategy for the final two debates, they may have encouraged the Pres to hold back (I think this is a mistake). More, though, they could reason that since Obama is very far ahead in the polls (by modern standards), it's better to make no news. Something arguing in this hypothesis' favor is the fact that very few campaign surrogates showed up to the "spin room" afterward to tout Obama's performance.

If this latter hypothesis is true, then it was probably a blunder. Right now nearly all the networks are out talking about how Romney won the debate, and nothing seems to move public opinion like consensus opinion in the media. The polls will probably start to move toward Romney in the coming week, and it's not hard to see why: his sales pitch was much better and none of his lies was effectively countered.

Other thoughts:

Romney's argument over teacher employment was masterful. Obama correctly points out that more than 100,000 teachers have been fired since the beginning of the recession. Romney counters that Obama "put $90 billion into  green jobs. ... that would have hired 2 million teachers." This is clever because it at once knocks the Pres for the Solyndra failure and implies that his priorities are all talk. It was entirely dishonest, because spending on teaching is in the "discretionary budget", which Romney wants to decimate, and because the green energy money was earmarked in the American Reinvestment and Recovery Act (AKA The Stimulus), and hence could not have been  used for this purpose. However, this point went uncountered by Obama.

A discussion about the Independent Payment Advisory Board was drummed up by Mitt:

Number three, it puts in place an unelected board that's going to tell people, ultimately, what kind of treatments they can have. I don't like that idea.

Afterward, fossilized nitwit George Will (rated one of the worst political prognosticators) proclaimed that this will become a major issue in this campaign, virtually ensuring that it will not. Unlike some of the other points, the president argued against this head on, and I didn't get the impression that this "death panel" nonsense served as anything more than a Republican dog whistle.

All of this being said, debates have not historically made much difference in presidential races.

Voter intentions before (x-axis) and after (y-axis) debates. The line represents "no change". Source: Erikson and Wlezien via Wonkblog

The only exceptions one can point to are 1976 (when Gerald Ford stupidly said that Poland was not under USSR control) and maybe 1988 (when Michael Dukakis, with no emotion, denied that he'd want the death penalty if someone raped his wife). Debates happen late in elections, when most people have made up their minds.

Nonetheless, Obama didn't do himself any favors tonight.

Older posts «

» Newer posts