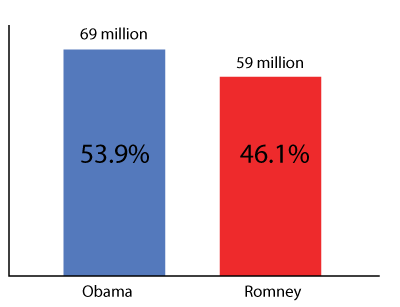
Let's say that we want to know how many people are going to vote for Obama and how many for Romney. The population of all voting people has a certain distribution (a number who vote for one, another number who vote for the other). For the sake of argument let's say it looks like this:
This is the population distribution. Now, we do not know this distribution, and we will not know it until election results actually come in. Since it's not practical to call each voter and ask what her preference is, a polling firm takes a sample. They might call 2,200 people chosen from many states and ask whom they intend to vote for, and tally the result. For instance, the latest Gallup poll put the proportions at Obama 49%, Romney 45%.
In this and some following posts, I want to address this question: what is the meaning of this poll result?
To begin to answer the question, let's run a simulation. We'll make a random number generator give us a number between 0 and 1. If the number it gives is less than or equal to 0.539 (Obama's hypothetical vote share) we count that as a person answering Obama, and if it's greater than 0.539 then we count that as a person answering Romney. Because the sample is random, we do not expect to get the exact proportion of the population distribution (we don't expect to get exactly 53.9%).
To start, we'll take a sample of 50 people. On the first simulation, 22 said Obama, and 28 for Romney, or 44%/56%. Curious, since it not only does not get the number right, it actually shows Romney with a lead. On the second run, I get 27 for Obama, and 23 for Romney (54%/46%). On a third trial, it's 62%/38%. We can see that with a random sample of only 50 people, we don't get very close to the real result and it's very noisy.
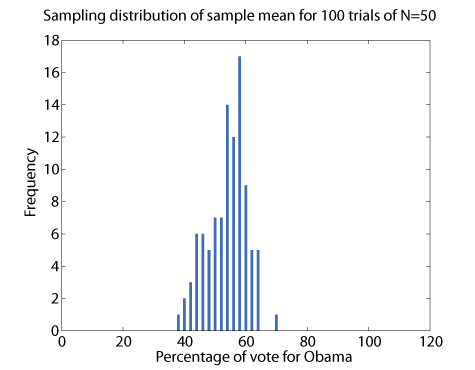
We can look at the distribution of the sampling mean, or the frequency of a certain result if we run our "poll" many times. Let's look at the number of times we get a certain percentage for Obama if we run the poll 100 times:

Sampling distribution obtained for a random sample with the above population distribution, polling 50 people. 100 "polls" were conducted to get this distribution.
The result is quite messy. Some of the polls show Obama under 45%, others show him well over 60%. However, the average of all polls is 53.7% of the vote for Obama, essentially what it is for the population distribution!
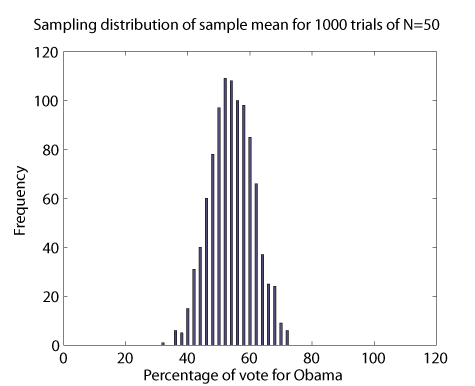
You might wonder whether we have any expectation for what this distribution should look like. To illustrate that we do, here's the exact same simulation except I ran it 1000 times instead of only 100. It's the same random number generator, the same number of people polled (N=50).
What we get is a bell-shaped curve. Suppose I calculate the mean  and the standard deviation
  of the results. Then, if I plot this same plot (except I divide by the maximum 109) along with the function

I get the following graph

Normalized simulation data for 1000 trials along with a normal distribution with the same mean and standard deviation as the results.
The curve in magenta, given by the formula above, is the normal distribution, and it fits extremely well. Since the standard deviation of these poll results is 7%, this curve being the trend implies that
- 63% of all your poll results are within seven percentage points of the true proportion
- 95% of all your poll results are within fourteen percentage points of the true proportion
- 99% of all your poll results are within 21 percentage points of the true proportion
That means that if you only do one poll, you have no confidence at all that it is close to the true proportion.
Seven percentage points is actually much smaller than the population standard deviation. If you let a vote for Obama equal 1 and a vote for Romney equal zero, and calculate the standard deviation of the population, you get

or a standard deviation of almost 50 percentage points. So actually our poll result has a smaller standard deviation than the actual population (which is good, since 50 points would be huge!). How much smaller?
The standard deviation of the sampling distribution is

exactly what we observed in our experiment. This is to say that the random error in your sample goes down as  , the number of people polled in each poll, goes up, but only as the square root.
What will the standard deviation be for a poll of 2200 people, such as the one Gallup conducts? It's

Thus, from a sampling standpoint alone, the Gallup poll has a relatively small 1 percentage point deviation. This isn't the end of the story, not by a long shot! But, as a first approximation, we might say that there is a 99% chance that the true result is either 3 points higher or 3 points lower than what Gallup measures. Thus, when you see a margin of error in the result like  , this reflects that the sample size being what it is, it is impossible to conclude with precision what the real population value is in this range by taking a sample; it could plausibly be anywhere between 51 and 57%.
More to come.


